> ## Documentation Index
> Fetch the complete documentation index at: https://docs.hitl.sh/llms.txt
> Use this file to discover all available pages before exploring further.
# Your Dashboard
> Navigate and understand your HITL.sh dashboard to manage loops, requests, and team members effectively
# Your Dashboard
The HITL.sh dashboard is your central command center for managing all aspects of your human-in-the-loop workflows. From here, you can monitor requests, manage loops, configure integrations, and track performance metrics.
## Dashboard Overview
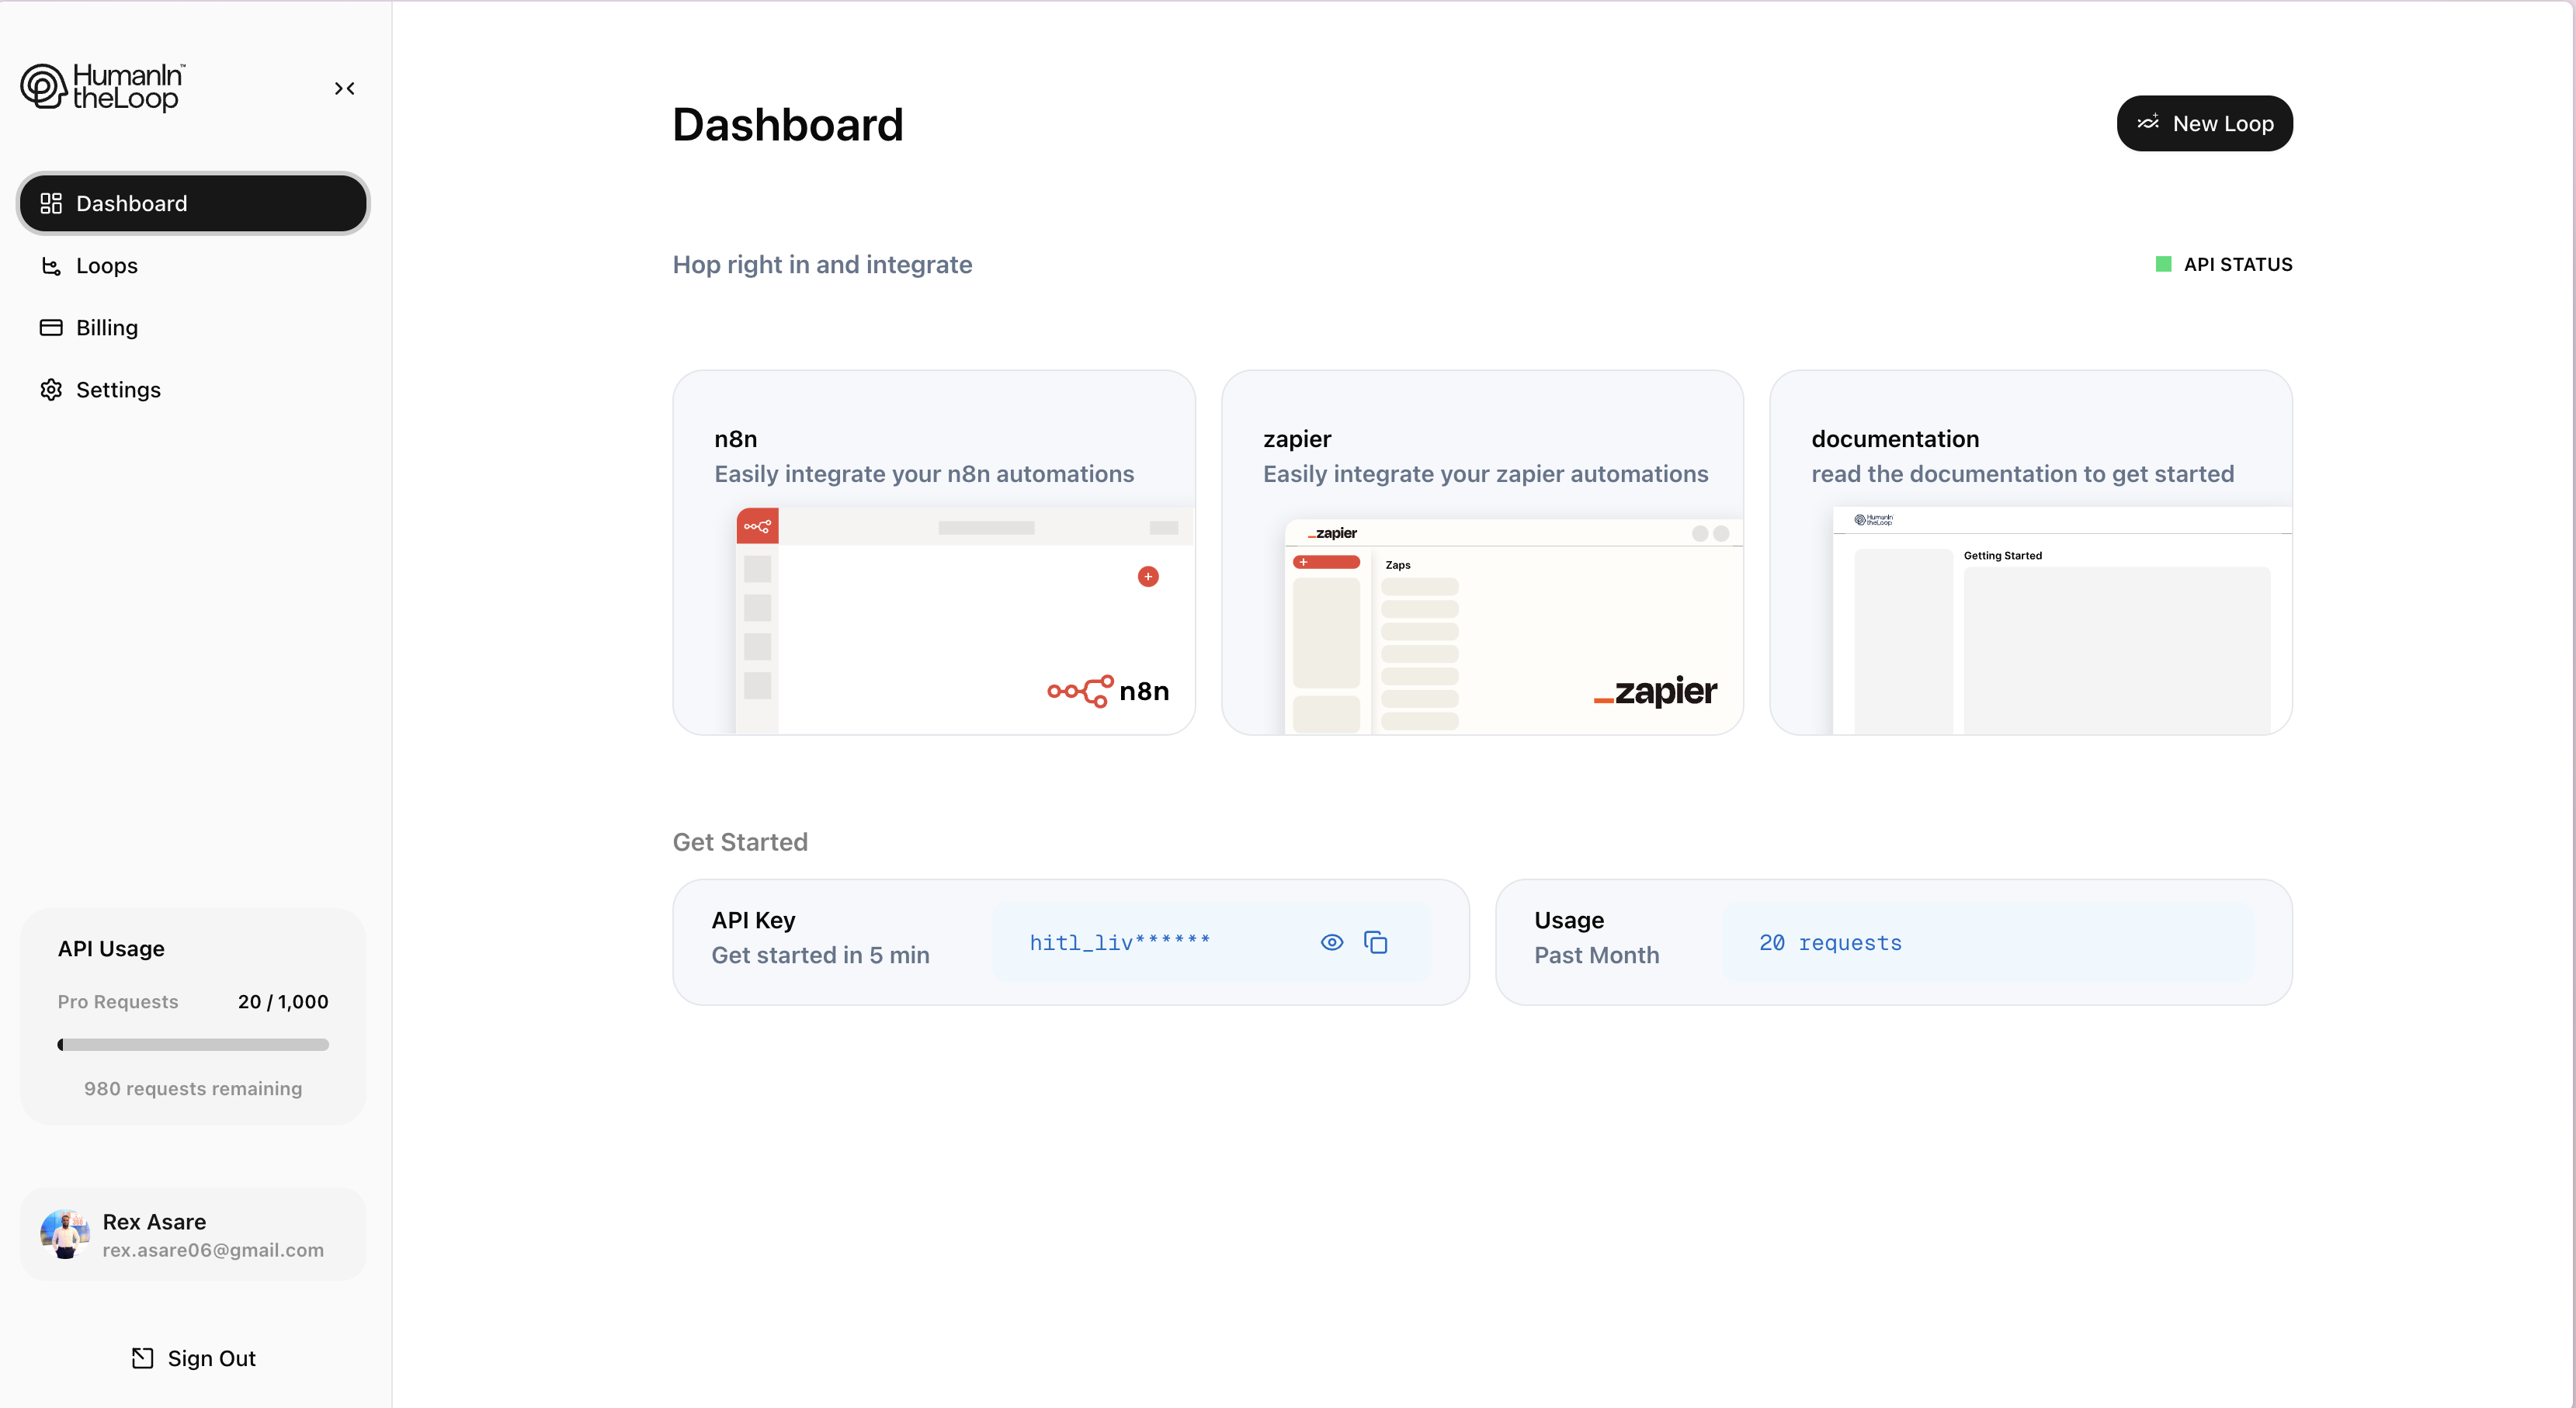 The dashboard is organized into several key areas:
* **Navigation Sidebar**: Quick access to all major sections
* **Overview Cards**: Real-time metrics and status information
* **Recent Activity**: Latest requests and actions
* **Quick Actions**: Common tasks and shortcuts
## Main Navigation
### Loops Management
The **Loops** section is where you create and configure your human-in-the-loop workflows:
View and manage all currently running loops in your system.
Create reusable loop configurations for common workflows.
### Requests Overview
Monitor all incoming and pending requests in real-time:
* **Pending**: Requests waiting for human review
* **In Progress**: Requests currently being reviewed
* **Completed**: Successfully processed requests
* **Failed**: Requests that encountered errors
Requests are automatically categorized by status, making it easy to identify bottlenecks or issues in your workflow.
### Team Management
Manage your human reviewers and their assignments:
* **Reviewers**: Add, remove, and configure team members
* **Skills**: Assign expertise areas to reviewers
* **Schedules**: Set availability and response time expectations
* **Performance**: Track response times and decision accuracy
## Key Metrics
Your dashboard displays essential performance indicators:
* **Average Response Time**: How quickly reviewers respond to requests
* **95th Percentile**: Response time for 95% of requests
* **Escalation Rate**: Percentage of requests that require escalation
* **Decision Accuracy**: How often human decisions align with expected outcomes
* **Inter-rater Reliability**: Consistency between different reviewers
* **Feedback Quality**: Quality of human feedback for AI improvement
* **Requests per Day**: Total number of requests processed
* **Peak Load Times**: When your system experiences highest demand
* **Loop Utilization**: How efficiently each loop is being used
## Quick Actions
Access common tasks directly from your dashboard:
Click the "Create Loop" button to set up a new human-in-the-loop workflow.
Add team members to handle requests in your loops.
Access detailed performance reports and insights.
Set up connections to your existing systems and tools.
## Dashboard Customization
Personalize your dashboard experience:
* **Widget Layout**: Rearrange overview cards to match your priorities
* **Notification Preferences**: Configure alerts for important events
* **Default Views**: Set your preferred default dashboard view
* **Theme Options**: Choose between light and dark themes
Dashboard customizations are user-specific and won't affect other team members' views.
## Mobile Dashboard
Access your dashboard on the go with our mobile-optimized interface:
Download our mobile app for iOS and Android to manage your loops from anywhere.
The mobile dashboard provides essential functionality while maintaining the same intuitive interface you're familiar with from the web version.
## Next Steps
Now that you understand your dashboard, you're ready to:
Configure authentication for your integrations.
Build your first human-in-the-loop workflow.
The dashboard is organized into several key areas:
* **Navigation Sidebar**: Quick access to all major sections
* **Overview Cards**: Real-time metrics and status information
* **Recent Activity**: Latest requests and actions
* **Quick Actions**: Common tasks and shortcuts
## Main Navigation
### Loops Management
The **Loops** section is where you create and configure your human-in-the-loop workflows:
View and manage all currently running loops in your system.
Create reusable loop configurations for common workflows.
### Requests Overview
Monitor all incoming and pending requests in real-time:
* **Pending**: Requests waiting for human review
* **In Progress**: Requests currently being reviewed
* **Completed**: Successfully processed requests
* **Failed**: Requests that encountered errors
Requests are automatically categorized by status, making it easy to identify bottlenecks or issues in your workflow.
### Team Management
Manage your human reviewers and their assignments:
* **Reviewers**: Add, remove, and configure team members
* **Skills**: Assign expertise areas to reviewers
* **Schedules**: Set availability and response time expectations
* **Performance**: Track response times and decision accuracy
## Key Metrics
Your dashboard displays essential performance indicators:
* **Average Response Time**: How quickly reviewers respond to requests
* **95th Percentile**: Response time for 95% of requests
* **Escalation Rate**: Percentage of requests that require escalation
* **Decision Accuracy**: How often human decisions align with expected outcomes
* **Inter-rater Reliability**: Consistency between different reviewers
* **Feedback Quality**: Quality of human feedback for AI improvement
* **Requests per Day**: Total number of requests processed
* **Peak Load Times**: When your system experiences highest demand
* **Loop Utilization**: How efficiently each loop is being used
## Quick Actions
Access common tasks directly from your dashboard:
Click the "Create Loop" button to set up a new human-in-the-loop workflow.
Add team members to handle requests in your loops.
Access detailed performance reports and insights.
Set up connections to your existing systems and tools.
## Dashboard Customization
Personalize your dashboard experience:
* **Widget Layout**: Rearrange overview cards to match your priorities
* **Notification Preferences**: Configure alerts for important events
* **Default Views**: Set your preferred default dashboard view
* **Theme Options**: Choose between light and dark themes
Dashboard customizations are user-specific and won't affect other team members' views.
## Mobile Dashboard
Access your dashboard on the go with our mobile-optimized interface:
Download our mobile app for iOS and Android to manage your loops from anywhere.
The mobile dashboard provides essential functionality while maintaining the same intuitive interface you're familiar with from the web version.
## Next Steps
Now that you understand your dashboard, you're ready to:
Configure authentication for your integrations.
Build your first human-in-the-loop workflow.